The question of rising inequalities in the United States is widely discussed, but what reality do they entail? Taking the example of San Francisco, this article casts a new light on the way to measure urban inequalities and to understand them.

Recherche

Download article:
PDF
|
The question of inequality has come to occupy an unprecedented place in the US national debate over the last few years. While Barack Obama presented inequality as “the defining challenge of our time” in his December 2013 State of the Union address, Capital in the Twenty-First Century (2014) has proved a momentous bestseller, and its author, French economist Thomas Piketty, has become a real star in the country. More broadly, almost two-thirds of Americans consider inequalities to be one of the most important social challenges today (Desilver, 2014). The question of inequality appears with special intensity in large cities—as illustrated for instance by the New York municipal election of November 2013, which Bill de Blasio won handily through focusing his campaign on the theme of social polarization and the slogan “A Tale of Two Cities.” Beyond consensual discourses on the growth of inequalities in the United States, this article aims to throw light on what the issue of inequality in American cities exactly entails, focusing on the case of San Francisco.
The City by the Bay—the historic capital of the West Coast and visitors’ favorite city—is part of a metropolitan area that is one of the largest (4th in terms of population size), most dynamic (its gross per capita income surpasses that of all other US metropolitan areas, and it is the world’s 21st economy), most innovative (it is the cradle of high technology and, according to Richard Florida, the symbol par excellence of the “creative class”), and wealthiest (just behind Washington) in the US. [1] At the same time, it is increasingly singled out by local, national and international media as one of the cities most emblematic of urban inequalities. To avoid any confusion, let us say at the outset that inequalities result from an extremely complex system of local, national and international factors, which we will not review in detail here. This article aims more simply to grasp what measured inequalities consist of and to what objective realities they correspond. In other words, it is concerned not so much with the “why” but rather with the “what” and the “how,” based on the conviction that this reflection is a (rarely met) prerequisite for any attempt to correct inequalities.
How to Measure Socioeconomic Inequalities?
The current debate on the growth of inequalities focuses first and foremost on socioeconomic inequalities. It draws on the work of statisticians and economists who seek to exploit the most relevant possible sources and build various indices with the goal of comparing levels of inequality in different entities (social or spatial entities such as countries or cities)—often in a temporal perspective. In order to understand the magnitude of inequalities in a city, one must therefore begin by examining with great attention the index being used to measure inequalities.
For example, a report published by the San Francisco Office of Economic Analysis presents a ranking of the most unequal large cities in the US based on the Gini index—which measures income distribution on a scale from 0 (everyone has the exact same income) to 1 (all income is concentrated in the hands of one household) (Egan, 2014). According to this ranking, the city of San Francisco occupies the 16th position, with a Gini index of 0.51 (see Figure 1).
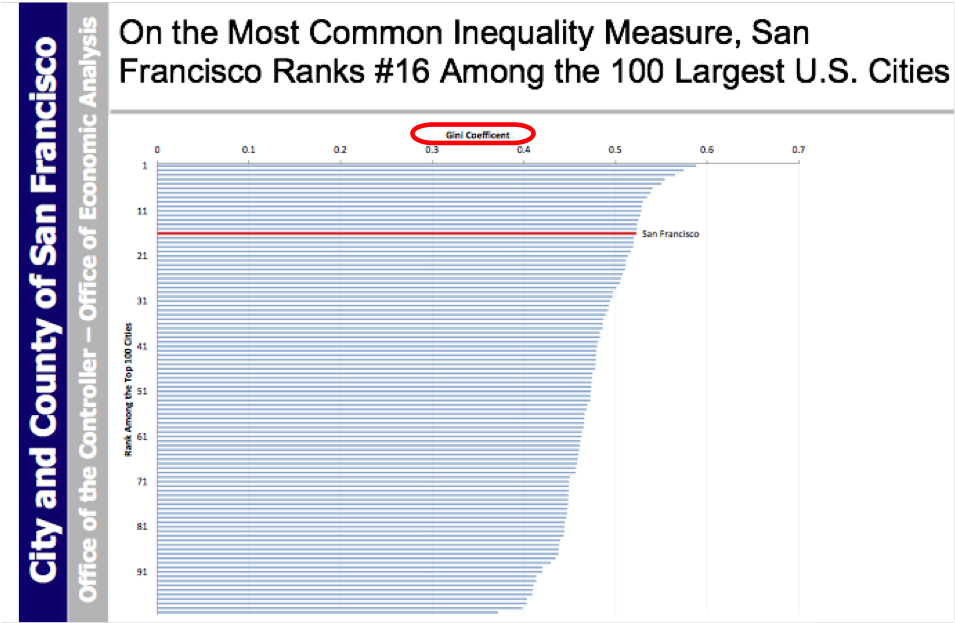
Figure 1: San Francisco: 16th most unequal large city based on the Gini index (2012)
Source: Ted Egan, 2014
Another index of inequality consists in calculating the ratio between the income of the richest population and that of the poorest population. In general, statisticians use the 80/20 ratio (i.e., the ratio of the 80th percentile income to the 20th percentile income); yet the authors of a Brookings Institute study preferred to calculate the 95/20 ratio, which helps to accentuate the contrast between the very rich households (income earned by the 95th percentile) and the poorest 20% of households (Berube, 2014). The ranking constructed from this measure pushed San Francisco up to second position—behind Atlanta and ahead of Miami—among the fifty most unequal large cities in the country (see Figure 2).
Thus, from one indicator to another (Gini or 95/20 ratio), San Francisco presents a significant gap (of fourteen places) in the ranking of the most unequal US cities. This confirms the importance of fully grasping the nature (and relativity) of the measure before trying to compare the magnitude of socioeconomic inequalities in different cities. In addition, the two above indicators are based on the same source, income, which has the advantage of being easily accessible since it is published annually by the US Census Bureau, yet also presents a number of limitations that ought to be kept in mind (Desilver, 2013).
First, income is, by definition, measured before taxes and transfers. In other words, it tends to emphasize the very inequalities that these are specifically intended to correct. Another limitation is that household income varies over the household’s lifetime, and computing it at “t” time does not account for these constant changes. Lastly, the statistics published by official census institutes tend to confuse labor income with capital income, and this is especially true of those reported by the US Census Bureau (Piketty, 2013).

Figure 2: San Francisco: Second most unequal large city according to the 95/20 ratio
Source: Berube, 2014
Several economists nonetheless believe that capital (or asset) inequalities are reflected more concretely in the everyday life of households than they are in income inequalities. Indeed, some households may receive relatively low labor income while benefiting from considerable capital (i.e., everything they own, including their homes, pensions, savings, financial assets, etc.), whereas other households with high income may have high expenses (e.g., child care costs or tuition fees) and low assets. Analyses reveal that capital inequalities are even greater than income inequalities, and that they, too, are growing rapidly. [2]
Lastly, other economists recommend focusing on consumption rather than on income or capital. In their view, household spending is a better indicator of welfare than income or capital because it helps take into account other resources such as access to credit, social benefits or even inherited capital. Several studies show that even though consumption-based inequalities are less pronounced than those based on income or capital, they, too, have significantly increased since the 1970s.
While debates between economists on the suitability of different measures of inequality are still open, the way these measures are conceptualized and calculated is rarely known to the public. Thus, the Brookings Institute ranking of the most unequal cities was published without qualification in several local and national media, decisively contributing to building San Francisco’s image as one of the most unequal cities in the country.
How Are Inequalities Structured?
However, to establish that San Francisco is one of the most unequal US cities hardly advances our understanding of the stakes involved in urban inequality. The same level of inequality may indeed conceal highly contrasting social realities. It is therefore essential to analyze with precision how these inequalities are structured.
The 95/20 ratio provides a first, more precise approach to this (see Figure 2): It reveals that San Francisco is marked by a structure of inequalities very distinct from that of other unequal cities like Atlanta or Miami. [3] For example, in Miami, inequalities result from the presence of very poor people and of a rich population that is moderately affluent compared to that found in the ten most unequal metropolitan areas of the ranking. In San Francisco, by contrast, there is a relatively large population of poor people, yet one that is substantially less poor than elsewhere: These peoples’ median annual income is twice that of their counterparts in Miami (Berube, 2014). [4] Most importantly, inequalities are made worse by the presence of a rich population with a particularly high income—a situation that has intensified in recent months since in 2014 the 95th percentile earned an annual income of 423,000 dollars, which is the highest of all large cities in the country (Berube, Holmes, 2015). San Francisco is, indeed, characterized by a very high concentration of “ultra-rich” individuals, those with assets of more than 30 million dollars. They numbered 5,400 in the metropolitan area (CSA) in 2014 (Wealth-X, 2015).
More than synthetic indexes like the Gini coefficient or even the 80/20 and 95/20 ratios, it is the distribution of households by income that helps to analyze with greater precision the structure of inequality, and its evolution (see Figure 3). Indeed, two groups [5] have grown in the city since 1990. They are, one the one hand, the poorest households (those living with less than 25,000 dollars a year), and, on the other, the richest households (those with more than 125,000 dollars a year)—among which those earning more than 200,000 dollars a year have experienced the most spectacular growth. Between the two, the middle categories, and especially the lower-middle categories, have on the contrary diminished considerably, thereby confirming the decline of the middle classes in San Francisco, whether they have become poorer (or richer?) or left the city altogether.
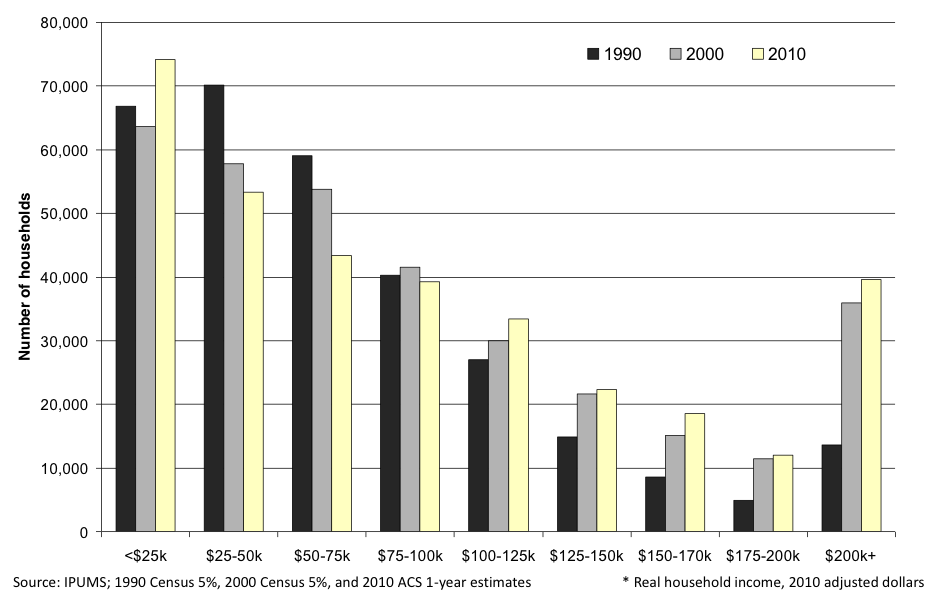
Figure 3: Changes in the distribution of household income in San Francisco (1990-2010)
Source: SFHSA, 2014
This trend towards income polarization, which has intensified over the past two decades, is linked in part to changes in San Francisco’s employment structure. [6] Indeed, the two sectors that have experienced significant job growth between 2004 and 2010 are the “creative” sector, which is characterized by a significant proportion of very high salaries, [7] and the leisure and tourism sector, in which low salaries largely prevail. Two other sectors have, on the contrary, lost jobs: While the decline has been slight in the financial and professional services sector, it has been more pronounced in the “local services” sector, with the latter precisely constituting the most important pool of medium-skilled and middle-income jobs (SFOEWD, 2014).
It is difficult, especially in the United States, not to consider the structure of inequalities in light of the ethno-racial question. In San Francisco, white households are the most numerous in the lowest income bracket (less than 25 thousand dollars). [8] This is a relatively surprising phenomenon in a city and a country where urban poverty is more readily associated with ethnic minorities—though it would probably be qualified if the measure of inequality were based on assets instead of income. Nevertheless, the situation does appear in a different light when one examines the prevalence of poverty in each ethno-racial category: Only a small proportion of Whites falls within this group (one sixth), whereas almost one in two Blacks, one in four Asians, and one in five Hispanics do. At the other end of the income scale, one in two white households earns an income of more than 100,000 dollars a year, and white households represent nearly two-thirds of all rich households (SFDPH, 2012). Thus social inequalities are also, to a large extent, ethno-racial inequalities.
The Importance of Scale: From the City to the “City Region”
A lot of data on inequality, like those just discussed, are calculated at the scale of cities. The scale at which inequalities are measured is thus the third element that we must examine.
Let us indeed recall that the City of San Francisco—which also corresponds, quite exceptionally, to the eponymous county—has approximately 800,000 inhabitants over 100 km2, within a metropolitan area (defined as Combined Statistical Area) that has 8.4 million inhabitants spread over 12 counties [9] (see Figure 4). This reminder highlights the many difficulties that come with thinking about the question of inequality in San Francisco. First, is it really relevant to compare inequalities (as measured by the Gini coefficient or the 95/20 ratio) in San Francisco with those in much larger cities like New York, Chicago or Los Angeles? The comparison would seem more solid, in the case of New York for example, if San Francisco were confronted with Manhattan, whose area and population are more comparable to its own. Second, does it make sense to restrict the question of inequality to a territory that represents barely 10% of the metropolitan population living on less than 2% of its area? More and more researchers stress the importance of the metropolitan scale, or scale of the “City Region,” for grasping the economic and social dynamics of the contemporary urban world (Storper, 2015). Yet at this scale the Gini coefficient, for example, drops to 0.47, which is the same value as that of the State of California or of the entire United States.
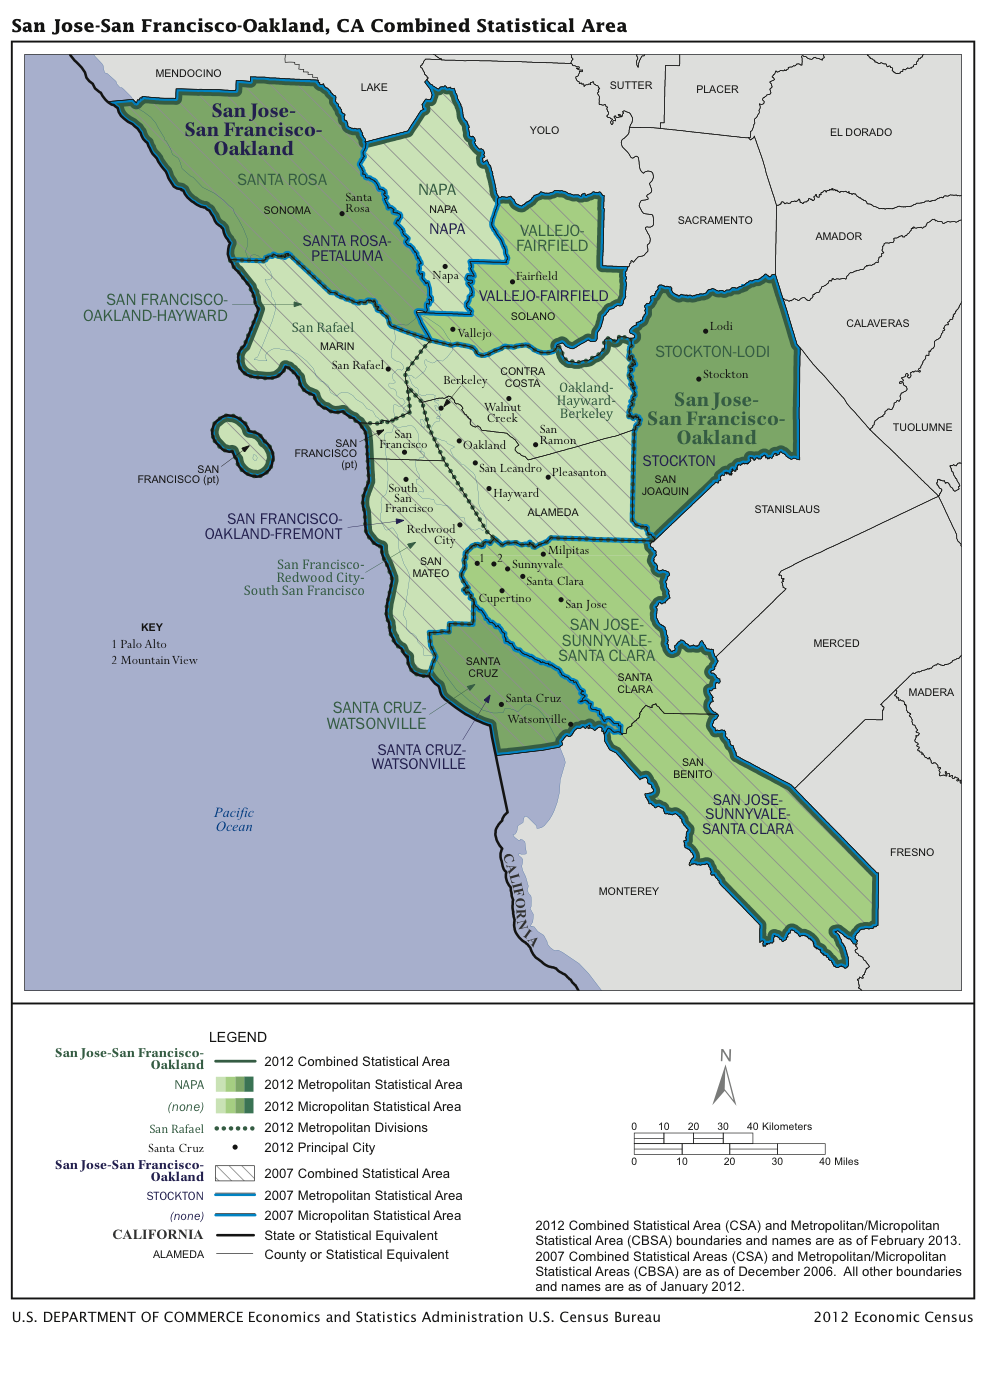
Figure 4: The variable geometries of San Francisco: from the city to the large metropolitan area
Source: US Census Bureau, CSA map, 2012-2007
Ultimately, this leads to carefully consider how inequalities are spatially deployed at different scales in the San Francisco Bay Area (see Figure 5). With a Gini index of 0.51, San Francisco appears as one of the most unequal counties of the entire Bay Area (with that of Marin). Other indicators should nonetheless be considered at the scale of counties. Indeed, San Francisco is not the richest county: its median income is just below that of the metropolitan area as a whole, far behind those of Marin, San Mateo or Santa Clara. Neither is this the county in which the richest households are the most numerous: Here as well, it ranks behind the three aforementioned counties. On the other hand, it is one of the two counties in which the poor are most represented. Finally, within the Bay Area, is the situation of San Francisco really more unjust than that of counties in which greater equality results either from the overconcentration of the ultra-rich (as is the case in the counties of San Mateo and Santa Clara), or, conversely, from the overrepresentation of the poor (as is the case in San Joaquin County)?
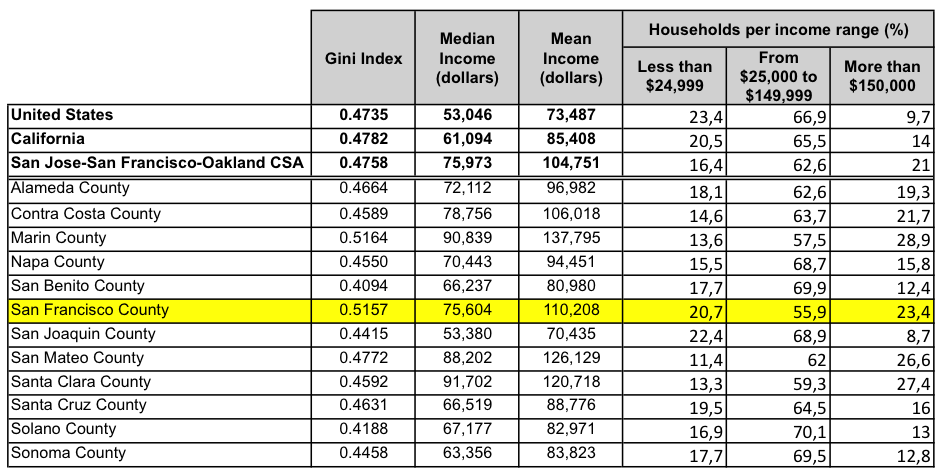
Figure 5: Inequalities in the counties of the Bay Area (2013)
Data from ACS 2013 (5-year estimates), US Census Bureau
Thus, studying the residential concentration of the very rich vs. the poor—that is to say, social segregation—seems more important than comparing inequalities in each county. Recall that the level of inequality does not prejudge the distribution of different income groups within the considered territory. A high coefficient of inequality may correspond to a situation of social mix, or, conversely, to a situation of social segregation. In the US, research has shown that in recent decades the rise of inequalities has been accompanied by the growth of income-based residential segregation in the thirty largest cities (Taylor, Fry, 2012). The San Francisco metropolitan area is no exception to this general trend, [10] but it is marked by relatively moderate segregation—just below the level of segregation observed in all metropolitan areas of the country. Moreover, San Francisco occupies an intermediate position when it comes to the segregation of the poor (15th position among the thirty largest metropolitan areas), and it is one of the metropolitan areas where the rich are somewhat less segregated (21st position).
Indeed, Figures 6 and 7 allow us to observe, on a very fine scale [11] and over the entire metropolitan area, how inequalities are deployed in various spatial configurations of social segregation or social mix. Over the small area of San Francisco city, neighborhoods with a high concentration of rich people (Pacific Heights, Sea Cliff, Westwood, etc.) coexist with pockets of poverty where the annual median income does not reach 50,000 dollars and where more than half the population lives below the national poverty line (Chinatown, Tenderloin, South of Market, Mission, Bay View-Hunters Point, etc.), as well as with several territories in which the rich live alongside the poorest. The metropolitan area’s other counties also include a number of areas where poverty is concentrated, including some that display a strong median annual income and a Gini coefficient below that of San Francisco. This is the case, for example, of Marin City, Redwood City or East Palo Alto. The county of Santa Clara has even more homeless people than San Francisco,’ [12] and “the Jungle”—the largest homeless squat in the US, with more than 200 people living on 68 acres—developed in the city of San Jose to the south of the Bay, until it was evacuated in December 2014 (Johnson et al., 2013). However, it is in the East Bay that the highest concentrations of poor people can be observed, in the flatlands that stretch along the Bay, from Richmond in the north to Oakland and to Hayward in the south, whereas the very rich live, more exclusively, up on the hills. [13] Alongside these pockets of poverty in or near the metropolitan area’s historic centers, new territories of poverty have developed in the farthest outskirts of the agglomeration (Dublin, Vallejo, Concord, Antioch, Santa Rosa, etc.): It is indeed in the margins northeast of the metropolitan area that poverty has increased most rapidly since 2000 (Soursourian, 2012; Schafran, 2013). Unsurprisingly, all the territories where poverty is concentrated are also predominantly populated by ethnic minorities (African-Americans, Hispanics or Asians), although in general racial segregation has tended to decline over the past decades in the US (while remaining higher than social segregation).
The San Francisco Bay Area thus constitutes a mosaic of territories with highly contrasting socio-spatial configurations, one that increasingly differentiates itself from the old traditional model that set poor inner cities against middle-class suburbs. Finally, the question of inequality in San Francisco loses much of its relevance unless it is observed on a very fine scale and over the entire metropolitan territory.
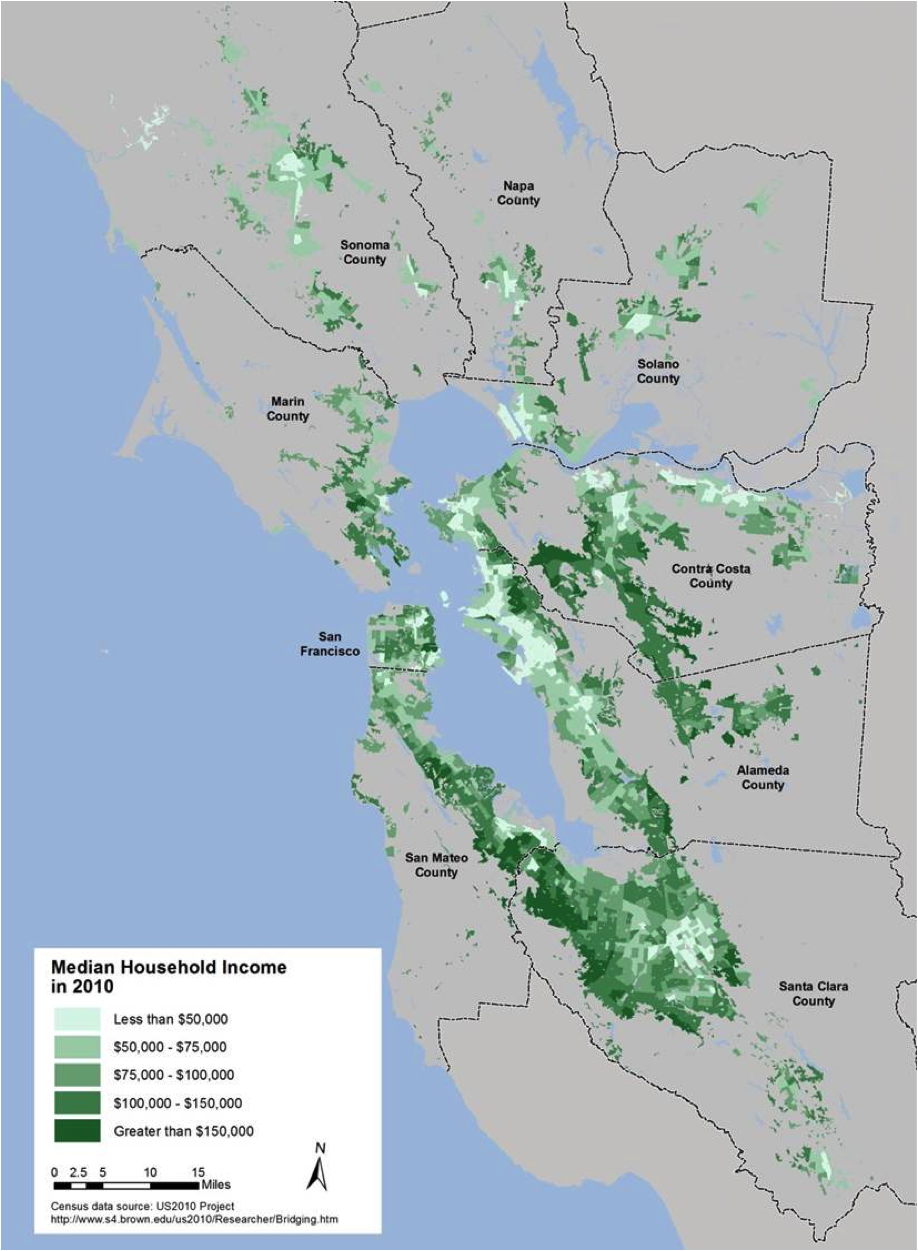
Figure 6: Median income by census block group (2010): socially contrasting territories
Source: ABAG, 2014 (2010 census data, US Census Bureau)
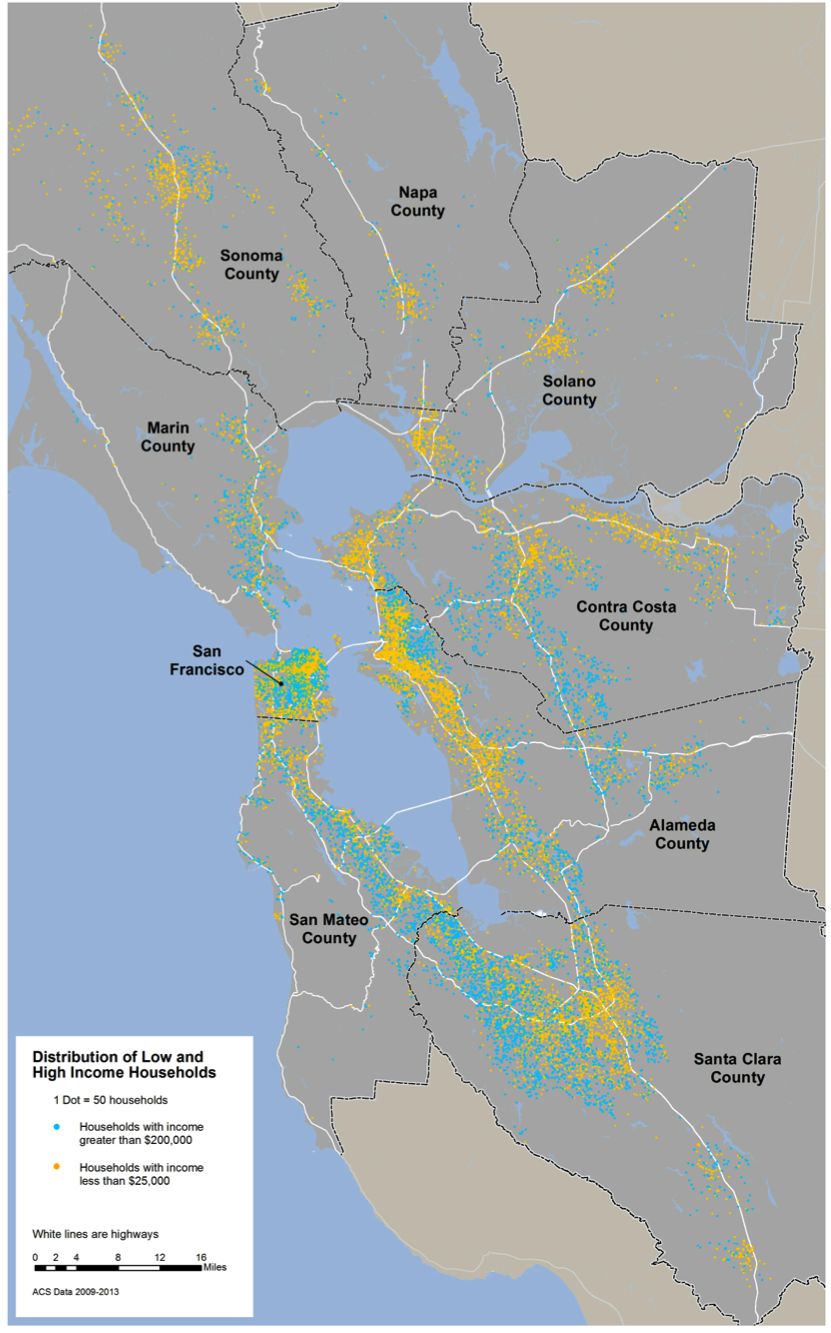
Figure 7: Distribution of the richest and poorest households (2010)
(a blue dot represents 50 households whose annual income exceeds $ 200,000;
a yellow dot represents 50 households whose annual income is below $ 25,000)
Source: ABAG, 2015 (ACS 2009-2013 data, US Census Bureau)
There is no doubt that San Francisco is an unequal metropolitan area. Yet more than the area’s level of inequality or its position in national or international rankings, what matters first is to understand the social and geographical features of the socio-economic inequalities that characterize it. Thus, it appears that inequalities in San Francisco display a very specific structure: They are driven by the presence of a significant population of very rich, and even ultra-rich people on the one hand, and of many poor people on the other, while also being deepened by the decline of middle-income households. In addition, they are marked by ethno-racial differences, as could be expected in the US context. Often presented on the scale of the City of San Francisco, these inequalities really only take on their full meaning when examined over the entire Bay Area—and this, at different scales, from the large metropolitan area to the counties and census tracts that comprise it. For only then does the multiplicity of socio-spatial patterns of inequality appear in all its magnitude. To move forward, one should also question the implicit confusion between the concepts of inequality and injustice—a confusion which underlies the entire debate and against which several philosophers have nonetheless raised objections. One should, therefore, ask whether the inequalities that characterize San Francisco do render it an unjust city. For example, if inequalities have intensified, is it not also because the city and its actors actively consent to the presence of, and arrange a space for, the most vulnerable populations? The research I am currently conducting seeks to explore this question, which is far more complex than may seem at first. In the end, only a refined understanding of the social and spatial complexity of inequalities, and of their just or unjust dimension in the specific context of San Francisco, can help us move beyond mere critique. Only then will it be possible to grasp the great diversity of issues these inequalities raise (in terms of housing, employment, education, etc.), and hence to reflect and construct, at the most relevant scales, the range of policies that will help respond to them.
by , 5 October 2015
Find us here :


Further reading
ABAG (Association of Bay Area Governments), Enhancing Regional Economic Prosperity: Fair Housing and Equity Assessment Report, 2014
BERUBE Alan, « All Cities Are Not Created Unequal », Brookings Institute, Metropolitan Opportunity Series n°52, 2014
BERUBE Alan, HOLMES Natalie, « Some cities are still more unequal than others – an update », Brookings Institute, 17 mars 2015
BOHN Sarah, DANIELSON Caroline, BANDY Monica, « Poverty in California », Public Policy Institute of California, 2015
CITY OF SAN JOSE, 2013 San Jose Homeless Census and Survey, 2013
DESILVER Drew, « The many ways to measure economic inequality », Pew Research Center, 18 décembre 2013 (consulté en ligne le 27/10/2014)
DESILVER Drew, « Americans agree inequality has grown, but don’t agree on why », Pew Research Center, 28 avril 2014
DOUZET Frédérick, La couleur du pouvoir : Géopolitique de l’immigration et de la ségrégation à Oakland, Belin, 2007
EGAN Ted, « Inequality in San Francisco », rapport, San Francisco Office of Economic Analysis, 26 juin 2014
JOHNSON Robert, ANDERSON Chris, NUDELMAN Mike, « Special Report : Homeless in Silicon Valley », 7 août 2013
KNIGHT Heather, « A decade of homelessness : Thousands in SF remain in crisis », San Francisco Chronicle, 2014 (consulté le 19/02/2015)
PIKETTY Thomas, Capital in the Twenty-First Century, Belknap Press, 2014
PIKETTY Thomas, Le capital au XXIe siècle, Seuil, 2013
SAEZ Emmanuel, ZUCMAN Gabriel, « Exploding wealth inequality in the United States », Washington Center for Equitable Growth, octobre 2014
SCHAFRAN Alex, « Origins of an Urban Crisis : The Restructuring of the San Francisco Bay Area and the Geography of Foreclosure », International Journal of Urban and Regional Research, n°37, 2013, p. 663-688
SFDPH (San Francisco Department of Public Health), Sustainable Community Index, City Indicator : San Francisco, Income Inequality, 2012 (consulté le 23/06/2015)
SFHSA (San Francisco Human Services Agency), « Economic Trends », Mai 2014
SFOEWD (San Francisco Office of Economic and Workforce Development), San Francisco Economic Strategy 2014 Update, 2014
SFPD (San Francisco Planning Department), 2013 San Francisco Commerce and Industry Inventory, 2014
SOURSOURIAN Matthew, « Suburbanization of Poverty in the Bay Area », Federal Reserve Bank of San Francisco, janvier 2012
STORPER Michael, The Economies of Cities : Divergent Economic Development, Stanford University Press, 2015 (à paraître)
TAYLOR Paul, FRY Richard, « The Rise of Residential Segregation by Income », Pew Research Center, Social and Demographic Trends, 2012
WEALTH-X, American Ultra-Wealth Ranking 2014-2015, 2015.
To quote this article :
Sonia Lehman-Frisch, « San Francisco: Unequal Metropolis », Books and Ideas , 5 October 2015. ISSN : 2105-3030. URL : https://booksandideas.net/San-Francisco-Unequal-Metropolis
Nota Bene:
If you want to discuss this essay further, you can send a proposal to the editorial team (redaction at laviedesidees.fr). We will get back to you as soon as possible.
You might also like
-
 by , 23 March 2012
 -
 by , 18 March 2010
 -
 by , 4 April 2019
 -
 by , 31 May 2021
Footnotes
[1] This information is derived from socio-economic datasets published on Vital Signs, a website developed by the Metropolitan Transportation Commission of San Francisco. It refers to the San Francisco Bay Area, considered in its nine counties (http://www.vitalsigns.mtc.ca.gov / accessed 01.07.2015).
[2] In the US, 10% of households own 77% of assets, and among them, the richest 0.1 % own 22 % of the wealth (against 7% in the late 1970s). This spectacular trend is logically accompanied by the erosion of the share of capital held by the middle and working classes (90 % of households), which fell by 36 % in the mid 1980s to 23% in 2012 (Saez, Zucman, 2014).
[3] San Francisco and Miami are defined here as cities.
[4] In 2012, 15% of the San Francisco population lived below the national poverty line. However, when the measure of poverty is adjusted to reflect the effects of both the local cost of living and social protection programs, the poverty rate actually reaches almost a quarter of the population (Bohn et al., 2015).
[5] A study by the Pew Research Center (Taylor Fry, 2012) defines “low income households” as those with less than two-thirds of the national median annual income, and “upper income households” as those with more than twice the national median annual income—the remainder being considered “middle income households.” Thus, in 2010, the first had an annual income below 34,000 dollars, and the second an annual income above 104,000 dollars. Moreover, in 2010, the federal poverty line was set at 22,315 dollars for a family of four (US Census Bureau).
[6] The San Francisco Office of Economic Development and Workforce distinguishes four major employment sectors in the city. The “Financial and Professional Services” sector includes companies that provide services to businesses as well as banks and insurance companies (107,000 jobs in 2010); the “Creative Industries” sector includes high technology, architecture, advertising and traditional media (69,000 jobs); the “Experience Industries” sector represents businesses primarily linked to tourism and leisure (hotels, restaurants, nightlife, arts, sports) (78,000 jobs). These three sectors, all defined by strong economic ties with the outside (at the scale of the region, the country, or even the world), rely on the “Local-Serving Industries” sector which is composed of businesses supplying goods and services to the city (health, education, retail, construction, transport, etc.) (186,000 jobs) (SFOEWD, 2014).
[7] This sector notably includes high technologies, which have been growing at a spectacular pace since 2010 and where the average salary was 154,000 dollars a year in San Francisco in 2013 (SFPD, 2014).
[8] Whites make up 40 % of poor households (against 32% for Asian households, 12% for Black households, and 11% for Hispanic households).
[9] The data derive from the American Community Survey 2013.
[10] In this Pew Research Center study, the metropolitan area of San Francisco is defined as the “Metropolitan Statistical Area” (MSA) of San Francisco-Oakland-Hayward—namely, a group of five counties.
[11] One of the smallest spatial units of the census is the census tract.
[12] There were 7,600 homeless in San Jose against 6,400 in San Francisco in 2013 (City of San Jose, 2013; Knight, 2014).
[13] For details on the development of the social geography of the eastern part of the Bay, and of Oakland in particular, see Douzet 2007.
Our partners


Sections
Keep in touch
© laviedesidees.fr - Any replication forbidden without the explicit consent of the editors. - Mentions légales - webdesign : Abel Poucet