


What do we really know about the costs and benefits of redistribution for the middle class? Two recent studies demonstrate that while it is certainly heavily taxed, so is the vast majority of the population—including people with low incomes. The real issue lies elsewhere—notably in the privileged situation of the richest 1% and the future of public spending.
Is the Middle Class a Victim of Taxation?
|
This article is the written version of a presentation made in January, 2012 to promote the publication of Dominique Goux et Éric Maurin’s new book Les Nouvelles Classes moyennes (The New Middle Class)(Seuil / République des Idées) at the Bellevilloise in Paris.
During the 2012 presidential campaign in France, issues of taxation and redistribution largely dominated the economic debate. Most of the time, these issues were tied to the situation of the so-called “middle class.” The members of these middling levels are seen as pivotal voters who must at all costs be seduced. Yet shoring up public finances requires raising taxes and social security deductions on a broad basis, which will invariably affect these same voters. Consequently, proposals for tax reform (adjusting the quotient familial,” [1] a “social VAT,” [2] etc.) are promptly attacked, on the grounds that the “middle class is hammered with taxes.” According to this view, whereas the working class benefits the most from redistributive policies and the wealthier classes largely evade taxation, only the middle class is a net contributor to our redistributive system.
This short article will discuss this widespread perception in light of newly available studies. We must first define the middle class, then present what is at stake in measuring redistribution, before discussing in detail one of the proposals made by Dominique Goux and Éric Maurin in their book, “The New Middle Class” (Les Nouvelles Classes moyennes, 2012), which argues for a re-targeting of redistributive policies.
Redistribution and the Middle Class
There is little unanimity in defining the “middle class.” Two main approaches exist. The first seeks to define this group in socio-economic terms. This is the approach followed by Goux and Maurin in their book, using the socio-professional categories (SPC) of the Insee (the French statistical institute). A different approach, however, which is more common in studies of tax and transfer redistribution, uses a definition based on household income. On the basis of income, the population can be divided into five (quintiles), ten (deciles), or hundred (centiles) equal groups. With this classification, we can distinguish between the “working class” (the 50% of the population with the lowest income), upper incomes (the wealthiest 10%), and the “middle class,” an intermediary group comprising 40% of the population.
The advantage of representing social groups according to socio-professional categories, as sociologists in particular do, is to identify a social condition that is more permanent than income, which varies considerably and depends largely on where individuals find themselves in their lifecycle. The disadvantage is that these large categories encompass widely divergent standards of living, which makes grasping the effects of the tax and transfer system more difficult.
Graph 1 represents the distribution of three major socio-professional categories according to the deciles of consumption levels—the latter having the advantage, compared to income, of being less inclined to represent temporary income bumps. It clearly shows that the middle class, defined by SPC, can be found across the living standards distribution, even if they are somewhat overrepresented in deciles 6 to 9. This is due in part to the fact that a spouse’s professional situation can significantly modify a household’s standard of living and to the fact that circumstances vary widely within any professional group, particularly among the “middle class”: an artisan who struggles to make the minimum wage will in fact have a standard of living which resembles that of most members of the working class, while a successful shop or a restaurant owner can earn a very high income.
Graph 1
Socio-Professional Categories According to Levels of Household Consumption
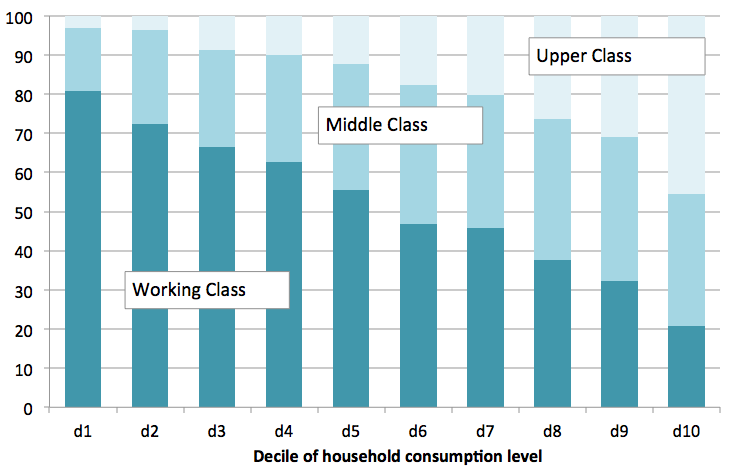
Source : Enquête Budget des familles, 2005.
NB: The middle class is defined according to the head of household’s SPC and includes the intermediary professions of the public and private sectors, artists, and merchants. Households are classified by level of household consumption. The first decile (d1) corresponds to the poorest 10% of households and the last decile (d10) to the richest 10%.
This comparison of representations of the middle class should encourage us to rethink this concept, particularly when we seek to represent tax and transfer redistribution. When one represents income distribution, it is important to be aware of the heterogeneity within the upper income bracket—that is, the income distribution’s upper decile—as the lower end of this group (individuals between centiles 90 and 95) are still quite close to the middle class (broadly defined) and its members willingly describe themselves as the “upper middle class.” In representing the tax and transfer system, it is important to bring these differences in the upper income bracket to light.
Systems of Redistribution
Redistribution by public authorities can assume numerous forms: taxation, of course, but also social transfers, social insurance, public spending, and regulation. Ideally, a balance sheet of redistribution should include all public policies. Unfortunately, at present, there are no studies that make it possible to account for the totality of public policies that contribute to the redistribution of living standards. Available studies usually confine themselves to some taxes and some transfers. The study of the redistributive effects of social insurance, public spending, and regulation largely remains to be done.
Moreover, a balance sheet of redistribution should not represent a given moment, but the entirety of transfers paid and received during a lifecycle. It is clear that retirement withholdings paid by the working population throughout their careers largely serve to finance retirement pensions and cannot be equated with other forms of taxation. [3] Less obviously, it must be remembered that there is mobility within different income brackets: one may be unemployed for months or even years, but financial shocks that last a lifetime are far more rare. Representing the redistributive effects of the tax and transfer system requires representing individuals according to their “permanent income,” independent of temporary or accidental bumps.
Current studies of the French social and taxation system rest on the use of micro-simulation models applied to a representative cross-section of the French population. A micro-simulation model simulates tax and social legislation as applied to individual characteristics (age, income, consumption basket, family circumstances, etc.) and makes it possible to calculate taxes paid and transfers received for a representative sample of the population.
Tax Incidence
A major difficulty in studying redistribution is the question of fiscal incidence, which consists in determining who ultimately pays taxes and other mandatory deductions. Indeed, all taxes—even those on companies—end up being paid by households. It is commonly accepted, for example, that the VAT, which companies pay, is mostly passed on to consumers through price increases. Similarly, national insurance contributions paid by employers are mostly passed onto employees through—over the long term—lower net salaries.
If the incidence of some taxes is well known, what we know about others is far more tenuous. For instance, the corporate income tax is likely paid in part by shareholders, but also by other forms of income from capital and perhaps by employees and consumers. If one chooses to present corporate income tax as falling solely on shareholders, it appears very progressive (as only those in the highest brackets have a significant share of their income in the form of shares); conversely, if the corporate income tax is paid by a broader share of the population, its progressive character is diminished accordingly.
This article presents the results of two recent studies of the French fiscal and social system, one based on the INES model developed by the Insee, [4] the other based on the TAXIPP model developed by the Institut des politiques publiques (Institute of Public Policy, or IPP). [5]
The Insee study divides the population into five equal groups and studies the redistributive effects of a share of tax and social security deductions and a share of social transfers (with indirect taxes, taxes on companies, and contributive national insurance payments set aside, along with insurance benefits). Graphs 2 and 3 reproduce these redistributive effects for 2010: taxes represent a significant share of the highest 20% of incomes (20% for the very highest), while social benefits represent a significant share of the lowest 20% of incomes.
Graph 2
Taxes by Income Quintile in 2010
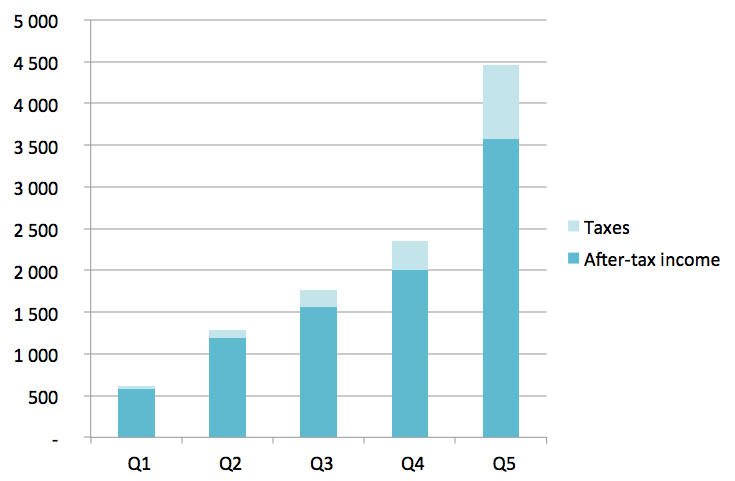
Source : Modèle INES, France portrait social 2011.
Key: Q1 corresponds to the first quintile of the income distribution, that is, to the lowest 20% of incomes. For the last quintile (Q5), average monthly pre-tax income is 4,500 euros, of which around 900 euros are paid in taxes, resulting in an income of 3,600 euros after taxes.
Graph 3
Disposal Income after Tax and Social Benefits in 2012
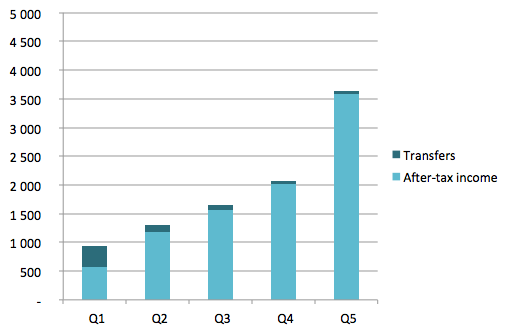
Source : Modèle INES, France portrait social 2011.
Key: Q1 is quintile 1, i.e., the 20% with the lowest income.
In this representation, the middle class is split between quintiles 3 and 5 and is particularly dominant in the fourth quintile. If one compares graphs 2 and 3, one realizes that while the middle class are net contributors to the system, they do not seem particularly “hammered.” One can thus calculate a net redistribution rate—transfers received minus taxes paid in relation to pre-tax income—that can be compared to chart 1. Households in quintile 4 contribute some 12% of their pre-tax income to redistribution, whereas the highest income bracket (quintile 5) contributes around 19%.
Chart 1
The Net Redistribution Rate in 2010
| Quintile 1 | Quintile 2 | Quintile 3 | Quintile 4 | Quintile 5 |
| 52.6 % | 1 % | - 6.6 % | - 11.7 % | - 18.7 % |
Source: modèle INES, Insee, France portrait social 2011.
The system appears to be redistributive, in which the highest incomes largely contribute to financing national solidarity and the middle class does not appear to be particularly threatened by those with lower incomes, if one compares net income after tax and transfers between quintiles 2 and 3 (or 3 and 4). The group that might feel the most “threatened” by redistribution is quintile 2 (the employed working class), which receives no net gain from redistribution, but whose net income is ultimately quite close to those in the lowest income bracket.
Two critiques can be made of such a representation. First, by classifying individuals according to their current income, artificial importance is given to temporary situations: the lowest quintile is dominated by unemployed people with low revenues, whose situation is mostly temporary; conversely, those with the lowest salaries do not belong to the lowest quintile and are concentrated in the middle of the income distribution, even though their permanent income might place them durably at the bottom of the lifetime income distribution. Second, aggregating the 20% with the highest incomes makes it impossible to distinguish the situation of the “upper middle class” (who are partially included in the upper income quintile) from that of the richest individuals. [6]
The TAXIPP model, developed by the Institut des Politiques Publiques, responds in part to these shortcomings by renewing the micro-simulation methodology in two respects. First, the model takes into account all taxes and social security deductions. Second, it finely simulates the upper end of the income distribution by drawing on a variety of sources, including administrative data.
Graphs 4 and 5, based on the TAXIPP model, breaks the population down into income groups ranging from the poorest to the wealthiest. The population is first divided into ten equal groups (deciles). Next, the upper decile (the richest 10%) is in turn divided into income subgroups. Thus P0-10 represents the poorest 10%, P10-20 the next 10%, P90-95 the 5% that comprise the lower half of the upper decile, and so on.
Graph 4
Taxes and Deductions on Primary Income in 2010
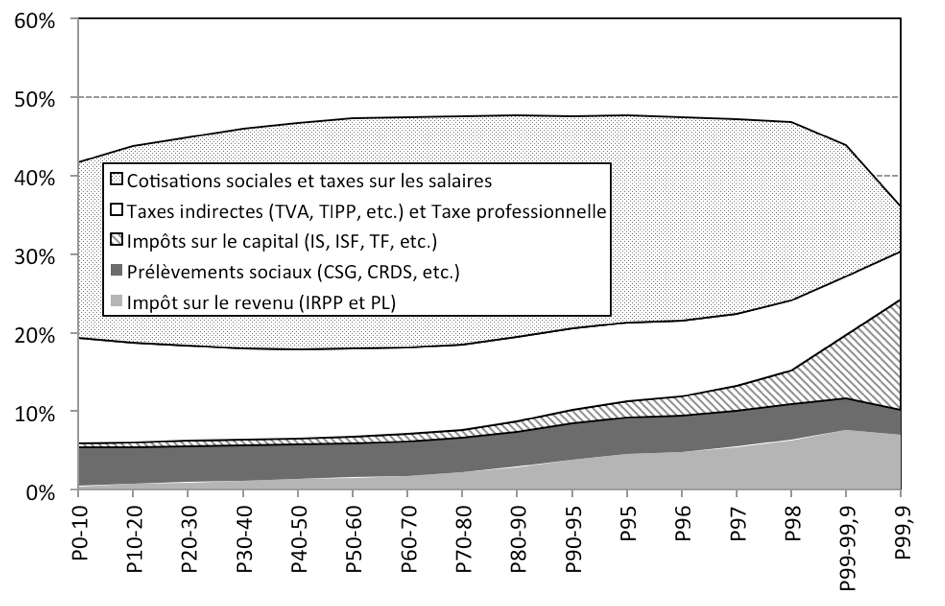
Source : TAXIPP 0.1, Bozio et al. (2012).
Domain: All individuals between 18 and 65 years old working at least 80% full time.
Key: Individuals are classified from the poorest (on the left) to the richest (on the right). Group P0-10 refers to the centiles between 0 and 10, i.e., the poorest 10%, group P10-20 the next 10%, etc. The richest 10% is broken down into subgroups. P99,9, for instance, corresponds to the richest 0.1%
Graphs 4 and 5 present the distribution of tax and social security deductions in 2012 as applied to two distinct domains. Graph 4 presents all tax and social security deductions in proportion to the primary income of all individuals between the ages of 18 and 65 who are working at least 80% full time. Primary income refers to all revenue from work and capital, but does not include replacement income (such as unemployment benefits or retirement pensions) nor social transfers. Graph 4 confines itself to the working population in order to approximate the permanent income distribution and ignores temporary income bumps. In this representation, the lowest income bracket is not comprised of unemployed people who have temporarily lost their jobs, but employees whose salary is close to the minimum wage. In 2012, the average rate of taxes and deductions (excluding taxes on social transfers and replacement income) was 43.2% for the population as a whole, but 45.6% if one includes only 18 to 65 year olds working at least 80% full time.
Graph 5
Taxes and Deductions on Secondary Income in 2010
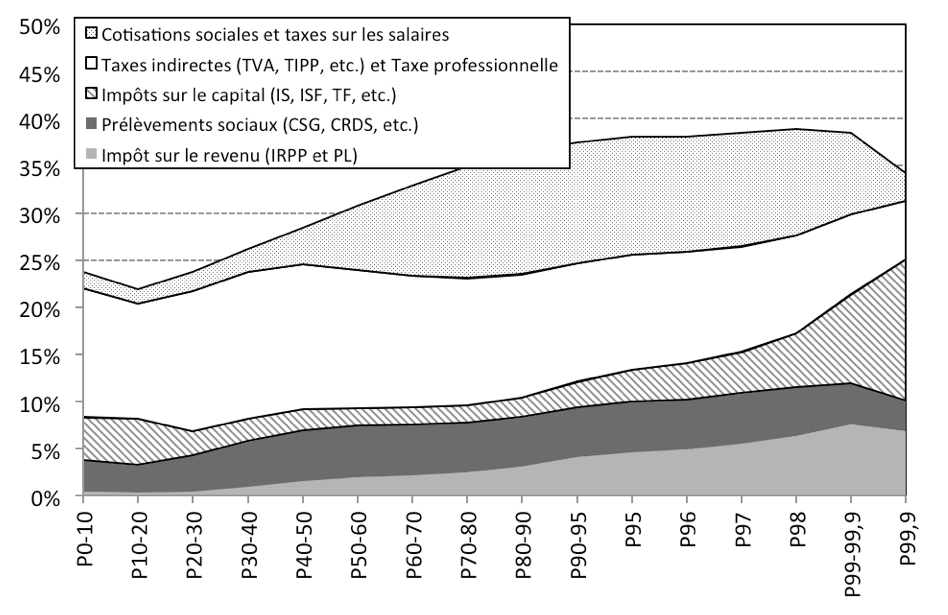
Source : TAXIPP 0.1, Bozio et al. (2012).
Domain: All individuals from age 18 to 65.
Graph 5 presents a complementary approach to the preceding one. The entire over-eighteen population is included this time, including those who are not employed (the unemployed and retirees). To make the representation of the tax and deduction rate meaningful, it makes sense not to confine oneself to primary income but to also include replacement income (unemployment benefits and retirement pensions). Secondary income thus refers to the totality of income from work, capital, and replacement incomes. The logic of this representation is to consider contributive national insurance payments not as ordinary taxes, but as mandatory contributions creating rights to deferred income. Contributive national insurance payments are thus excluded from both taxes and deductions and income. By including non-working individuals, this approach makes it easier to account for fiscal provisions benefiting the unemployed and retirees, though it gives excessive weight to temporary situations. In particular, this representation offers a partially artificial appearance of progressiveness, because it leaves out the non-contributive national insurance payments that are made by retirees, who are overrepresented at the lower end of the secondary income distribution.
Of the two domains presented, a significant distinction within the highest income bracket is evident. The upper middle class (deciles 90 to 95) and the well-off (deciles 95 to 98) receive most of their income from heavily taxed labor income. At the top of the distribution, the richest 1% earns most of its income from capital income, which is taxed far less.
In these representations, the middle class, including the upper middle class, is subject to a high level of taxation—slightly higher than the highest income bracket, but also slightly higher than employees at the minimum wage level. What this analysis reveals is high taxation levels on labor income at all income levels. Because of the high level of indirect taxation, national insurance contributions and the CSG, [7] taxes and national insurance contributions in France are largely proportional to income. The middle class does pay a high level of taxes and deductions, but so does the working class: the average rate of tax and deductions for an individual earning the minimum wage is 42%, compared to 47% for a middle-class income level.
Is the middle class alone in bearing the fiscal burden? If one employs a narrow definition of the middle class (deciles 6 to 8), the answer must be “no”: a significant portion of the upper income decile pays at a rate that is just as high. There is however a real distinction within the top 10%, between the wealthiest (the top 1%) and the rest. Incomes in the highest group are essentially derived from capital income (capital gains, dividends, etc.), which is subject to a special tax rate – lower than the standard income tax rate –, allowing its members to enjoy a lower effective tax rates than others with high incomes.
What Should Redistributive Policies Target?
In their book, Dominique Goux and Éric Maurin recommend reconsidering the targets of redistributive policies in order to “return to the path of reforms that, rather than being targeted and narrowly categorical, are resolutely universalistic.”
This recommendation harks back to the old debate on the structure of the welfare state—between an assistance model, in which the state mainly seeks to create a safety net and fight poverty and an insurance model, in which the entire population is insured against social risks (unemployment, retirement, health, etc.), even if no significant redistribution between individuals with different levels of permanent income is achieved. The debate has crystallized around measures that are intended to be universal (and thus benefit those with the highest incomes) and those that are means-tested (and thus limited to the poor). The choice is a budgetary one: the more the targeting is real, the more a given financial effort will be efficient in the struggle against poverty.
Goux and Maurin are rightfully critical of the current targets of public policy, which stigmatize the poorest citizens while creating inefficient threshold effects. What makes their work original is that, in favoring a return to more universalistic policies, they do not propose returning to the old insurance/assistance debate: to the contrary, they want targeting, while avoiding threshold effects. They offer a few examples relating to education policy: rather than concentrating resources on a few high-priority zones, it is preferable to determine the level of credits by increasing investment of public spending based on the characteristics of specific schools. This will avoid both the stigmatization of students from high-priority zones and the pressure on schools to receive the “high priority zone” designation as a way of obtaining additional credits.
The same idea could be used for other public policies, such as taxation: the earned income tax credit (or prime pour l’emploi, PPE) creates the impression that those with low incomes receive significant social transfers, when in fact it is their tax and social security contribution bills that are being reduced. At the minimum wage level, employees receiving the earned income tax credit also pay the CSG and the CRDS, [8] making them net contributors. In an integrated fiscal system, the same effect may be obtained through a progressive tax on integrated income. This would make the tax and social system more comprehensible. The same remark could be made about retirement policy, where layer upon layer of different systems makes it hard to identify which measures are aimed at providing insurance and which are aimed at achieving redistribution. To resist threshold effects in redistribution policies, we must strive to unify the various mechanisms that comprise our redistribution system.
***
The middle class is an entity whose contours are hard to identify when evaluating redistribution systems. It encompasses such a diversity of income situations that the risk of caricature is great. Even so, it is clear that the theme of a “middle class hammered by taxes” finds little corroboration in an analysis of our redistributive system. The middle class is certainly heavily taxed, but so is the vast majority of the population—including those with lower salaries—and it is not particularly threatened by the low income bracket. A real boundary lies within the wealthiest class of citizens, but it does not oppose the middle class and the highest incomes so much as the richest 1% and a vast ensemble that includes even well-off households.
During the presidential campaign, all the candidates promised higher taxes for the wealthy. Yet these increases will not spare the middle class: whether they emphasized increasing the VAT or national insurance payments, most candidates agreed that taxes and deductions must rise. It is perhaps the evolution of public spending (the redistributive effect of which this article has left aside) that will become one of the main issues for the middle class in the new presidential term.
Previously published in French in laviedesidees.fr. Translated by Michael C. Behrent with the support of the Institut français.
by , 28 May 2012
Share this article
Find us here :


To quote this article :
Antoine Bozio, « Is the Middle Class a Victim of Taxation? », Books and Ideas , 28 May 2012. ISSN : 2105-3030. URL : https://booksandideas.net/Is-the-Middle-Class-a-Victim-of
Nota Bene:
If you want to discuss this essay further, you can send a proposal to the editorial team (redaction at laviedesidees.fr). We will get back to you as soon as possible.
You might also like


Footnotes
[1] The French income tax is computed at the household level taking into account the number of adults and children in the household. The idea of the quotient familial is to divide the taxable income of the household by the number of equivalent-adults. This system provides income tax reductions to large families with high income.
[2] A proposal to use the VAT tax to pay for social benefits normally financed by employer and employee withholdings.
[3] Especially in France where public pensions have a marked contributory aspect
[4] Conseil des prélèvements obligatoires (Council on Tax and Social Security Deductions), Prélèvements obligatoires sur les ménages. Progressivité et redistributivité), May 2011; INSEE, France portrait social 2011.
[5] L’Institut des politiques publiques (IPP) is a joint effort of the PSE-Ecole d’économie de Paris and GENES-CREST. See A. Bozio, Dauvergne, R., Fabre, B., Goupille, J., Meslin, O., Fiscalité et redistribution : 1997-2012, May 2011; INSEE, France portrait social 2011.], March 2012.
[6] The INES model relies on data that makes a more fine-grained study of upper incomes impossible.
[7] The CSG (Contribution sociale généralisée [Generalized Social Contribution]) is a French income tax without a progressive schedule (a “flat tax”), created in 1990 to finance the French social security systemt.
[8] The CRDS (Contribution pour le remboursement de la dette sociale [Contribution for the Reimbursement of the Social Debt) is a French income tax (with a flat rate of 0.5%) created in 1996 for the purpose of paying back the Social Security deficit.
Our partners


Sections
Keep in touch
© laviedesidees.fr - Any replication forbidden without the explicit consent of the editors. - Mentions légales - webdesign : Abel Poucet